

By: Steve Tomisek, CFP® | Partner and Chief Investment Officer
There is an old saying that calm waters do not produce skilled sailors. In the world of investing, few periods have illustrated this truth more vividly than the first half of 2026. Investors navigated significant events, including the war in Iran, oil-driven inflation reaching multi-year highs, and ongoing questions surrounding artificial intelligence (AI). Despite these headwinds, markets climbed to new all-time highs, corporate earnings expanded at a double-digit pace, and a broad range of asset classes delivered positive results. The opening six months of 2026 served as a powerful reminder of why staying invested and maintaining a long-term perspective matters so much.
This lesson carries even greater weight today, as the business cycle has entered its seventh year while the market cycle approaches its fifth. For many investors, it can feel as though the same set of concerns, including inflation, Federal Reserve policy, and valuations, keep cycling back into focus. Navigating these competing challenges is not an obstacle to successful investing; it is a fundamental part of it, and it is precisely why investors who stay the course tend to be rewarded over time.
The second half of 2026 will almost certainly bring its own unexpected developments, from the ongoing Middle East conflict to the upcoming midterm election and new market activity such as initial public offerings (IPOs). Understanding how to maintain perspective as these events unfold is essential for every investor.
Key market and economic highlights from the first half of 20261
- The S&P 500, Nasdaq, and Dow Jones Industrial Average returned 9.6%, 12.8%, and 8.9% year-to-date through the end of June, respectively. The second quarter was historically strong, with the S&P 500 returning 14.9%, the Nasdaq 21.4%, and the Dow 12.9%.
- The Bloomberg U.S. Aggregate Bond Index rose 0.6% year-to-date. The 10-year Treasury yield ended the second quarter at 4.47%, up from 4.17% at the start of the year.
- Developed market international stocks (MSCI EAFE) gained 7.7%, and emerging market stocks (MSCI EM) returned 22.7% year-to-date, both in U.S. dollar terms.
- The Bloomberg Commodities Index rose 12.3% year-to-date, driven by a strong first quarter gain of 23.3%, followed by a decline of 8.9% in the second quarter.
- Brent crude peaked just under $120 per barrel in May before closing the quarter at $73 per barrel.
- Gold prices fell to $4,007 per ounce, while Bitcoin declined to a recent low of $58,633.
- Headline CPI rose 4.2% year-over-year in May, largely driven by energy prices. Core CPI, which excludes food and energy, rose 2.9%.
- The Federal Reserve held rates unchanged at 3.50% to 3.75% throughout the first half of the year. Kevin Warsh was sworn in as Fed Chair in May.
The business cycle has now entered its seventh year
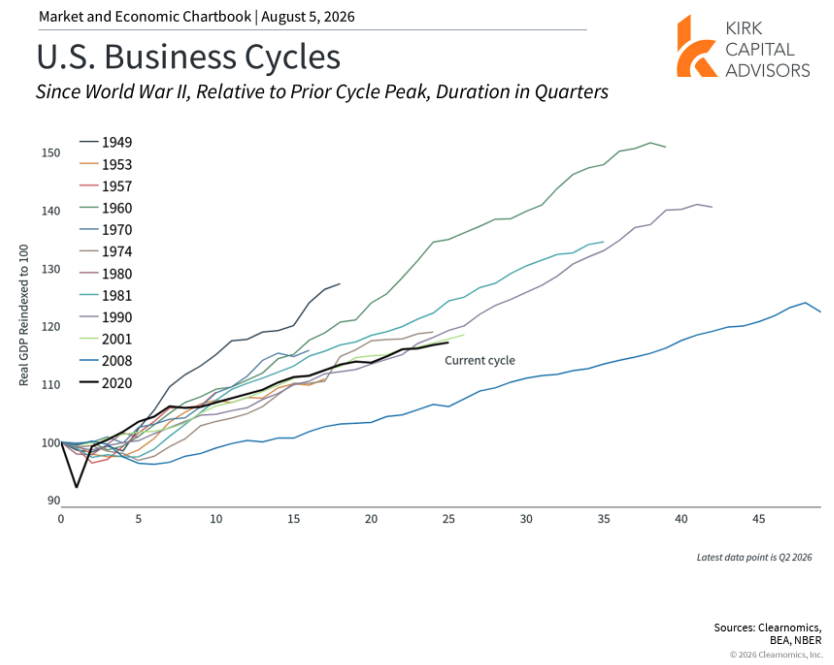
Some investors may find it surprising that the current business cycle traces its origins back to April 2020, in the depths of the pandemic, and quietly passed its sixth anniversary during the second quarter. There have been several moments along the way when recession fears flared, most notably when inflation peaked in 2022 and when tariffs disrupted global trade last year. Through each of these challenges, the economy proved resilient, continuing to grow at a steady pace.
The business cycle touches virtually every dimension of investing and financial planning, from mortgage costs to wage growth. A healthy economy supports consumer spending and business investment, which in turn fuels corporate earnings and, ultimately, stock market returns. While the stock market and the broader economy are distinct, they are closely intertwined. The chart above places the current cycle in historical context. The longest expansions on record, including the cycle that followed the 2008 financial crisis and the boom of the 1990s, lasted a decade or more.
Where does the economy stand today? Inflation remains elevated but may ease if oil prices stay low. The labor market has regained momentum, reversing last year’s concerns about sluggish hiring. The dollar has stabilized and recently recovered some ground, trade conditions remain uncertain but have settled somewhat, and business investment has picked up. Consumers are expressing caution in surveys, yet continue to spend on both essential and discretionary goods. On balance, the economy appears healthy despite some mixed signals, which historically bodes well for financial markets over the long run.
Broad asset class gains have supported diversified portfolios this year
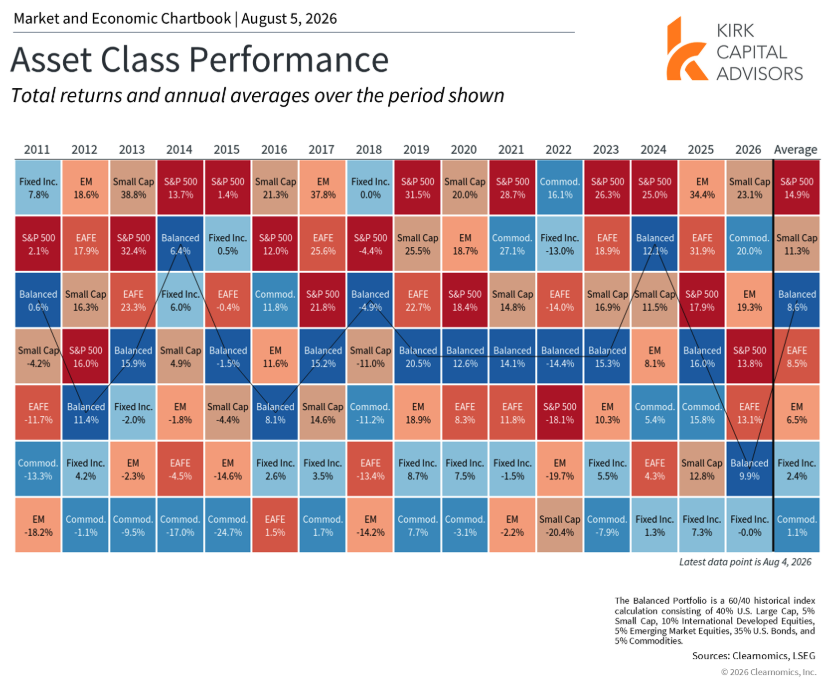
A wide range of global asset classes have contributed positively to portfolios in 2026, building on the trend established last year. As the chart above illustrates, gains have extended well beyond large cap stocks represented by the S&P 500 to include small caps, emerging markets, and commodities. The second quarter, in particular, ranked among the strongest on record, partly reflecting the timing of the Iran conflict, which meant that the market recovery got underway at the very start of April.
Several themes have underpinned these returns, including the resilience of the economy, optimism around a potential peace deal in Iran, and enthusiasm for AI. Many of these factors have supported strong corporate earnings growth, with profits for S&P 500 companies rising more than 20% over the past twelve months.2 This positive market environment has also sparked a wave of high-profile IPOs, including SpaceX in the second quarter, with the listings of OpenAI and Anthropic, both AI companies, anticipated to follow.
While investors naturally pay close attention to the first few days of an IPO when media coverage is at its peak, the real value of these listings tends to accumulate over a much longer horizon. Their significance lies in broadening the investment opportunity set for all investors, which is particularly important given the trend of companies remaining private for longer periods. What matters most is how these businesses perform across full market and economic cycles over the years and decades ahead. The largest technology companies today, for example, have built their scale through many such cycles.
These positive trends have pushed U.S. stock valuations to historically elevated levels. The S&P 500 currently trades at a price-to-earnings ratio of 20x, above its long-term historical average of 16x.3 Such valuation measures are not reliable predictors of near-term market performance, but they serve as useful guides when constructing long-term portfolios and considering diversification across asset classes. Taken together, this year’s results underscore the enduring value of a balanced approach.
Inflation remains a concern, though declining oil prices offer some relief
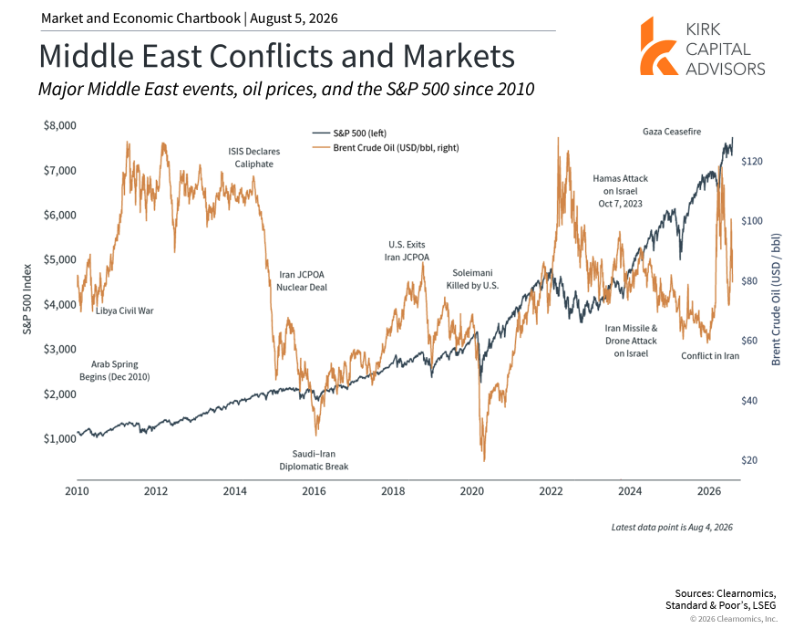
The fluctuations in the Iran conflict have affected the U.S. economy most directly through energy markets. Disruptions to oil shipments through the Strait of Hormuz pushed Brent crude to nearly $120 per barrel before prices retreated sharply. In recent weeks, oil has fallen to around $70 per barrel, approaching pre-conflict levels. Gasoline prices have followed a similar trajectory on a lagged basis, peaking above $4.50 per gallon nationally before pulling back below $4.00 per gallon.4
These swings in energy prices have had a direct impact on inflation readings. The Consumer Price Index rose 4.2% year-over-year in May, its highest level in several years, with the gasoline component surging 40.5% over the same period. Notably, core CPI, which strips out food and energy, rose only 2.9%.5 This distinction highlights that inflationary pressure has been concentrated in fuel costs rather than spreading broadly through the economy.
With oil prices declining in recent weeks, many economists believe inflation may be near its peak. This pattern echoes other historical geopolitical disruptions to oil supply, such as Russia’s invasion of Ukraine in 2022 and others shown in the chart above. Once those situations stabilized, oil prices typically recovered, and inflation rates moderated over time.
Market volatility has remained at manageable levels
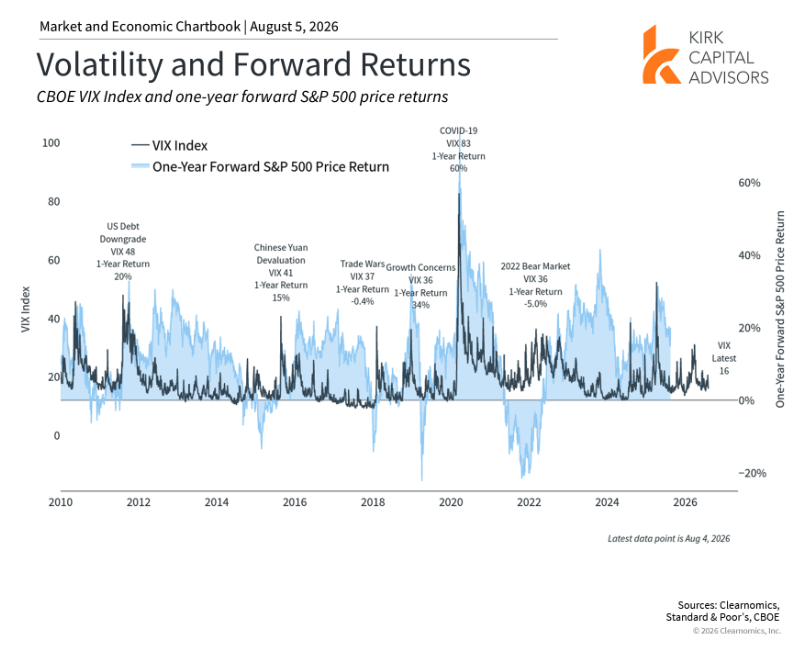
Investors have become familiar with brief bouts of volatility triggered by macroeconomic developments. Tariffs, the Middle East conflict, and uncertainty surrounding the Fed have all contributed to short-lived market swings over just the past year. This can be observed in the VIX, a widely followed measure of stock market volatility. The current VIX reading of 16 sits below its long-term average of 18.4 and well below recent peaks, as shown in the chart above. This also illustrates that periods of elevated volatility can present meaningful market opportunities.
Another useful way to assess the impact of market swings on investors is to examine the largest drawdown within a given year. In 2026, the S&P 500’s deepest peak-to-trough decline has been 9%. Pullbacks of this magnitude are never comfortable to experience, but markets have a history of rebounding when investors least anticipate it. Today, not only has the market fully recovered from its earlier decline, but the S&P 500 has registered 24 new all-time highs so far this year.6
The first half of the year reinforces a key principle: the most significant risk investors face during turbulent periods is not the volatility itself, but how they respond to it. The temptation to time the market during uncertainty is understandable, but it frequently proves counterproductive. A more effective approach is to hold a well-constructed portfolio designed to endure all phases of the market cycle while remaining aligned with long-term financial goals. This positions investors to navigate the inevitable uncertainties that the second half of 2026 will bring.
Remaining invested is critical to long-term financial success
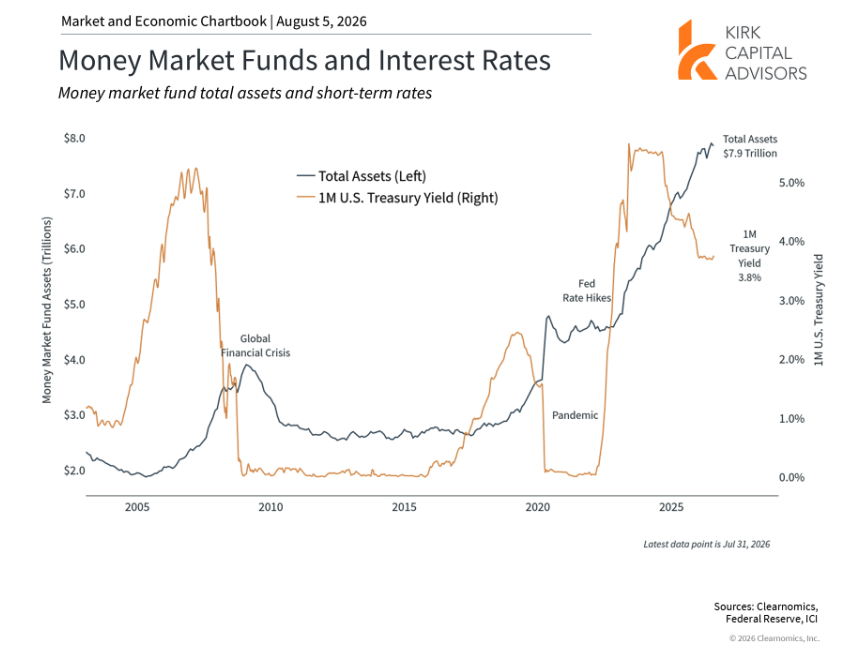
One consequence of investors stepping away from markets during volatile periods is the accumulation of what is often called “cash on the sidelines.” The central challenge with this approach is determining when to re-enter the market. The chart above illustrates the scale of this phenomenon today. Money market fund assets have reached a record $7.9 trillion, more than double their pre-pandemic level when interest rates were near zero. This reflects both the uncertainty that has characterized markets in recent years and a period of higher short-term rates that made holding cash more appealing.
Although cash can feel like a safe harbor, it carries its own risks. Cash yields often fail to keep pace with inflation. For example, current average rates on certificates of deposit mean that the real income from cash holdings is negative after adjusting for inflation.7 Even when nominal yields on money market funds and short-term instruments look attractive, sustaining those rates and staying ahead of inflation over time presents a genuine challenge. As a result, the purchasing power of cash holdings can erode steadily.
This is precisely why maintaining a balanced portfolio capable of generating growth, income, and capital preservation remains so important. As the market and economic cycle continues to evolve, this principle will only become more relevant.
The bottom line? The first half of 2026 has rewarded investors who stayed diversified and maintained a long-term perspective, even as geopolitical and economic headlines created short-term uncertainty.
References
- All figures are as of June 30, 2026 and are on a price return basis unless otherwise noted
- Clearnomics research and LSEG data as of June 30, 2026
- Ibid.
- https://gasprices.aaa.com/
- https://www.bls.gov/news.release/cpi.nr0.htm
- Clearnomics research and Standard & Poor’s data as of June 30, 2026
- Clearnomics research and FDIC data as of June 30, 2026
Index Descriptions
S&P 500
The Standard & Poor’s 500 Index is a capitalization-weighted index of 500 stocks designed to measure performance of the broad domestic economy through changes in the aggregate market value of 500 stocks representing all major industries.
Dow Jones Industrial Average
The Dow Jones Industrial Average consists of 30 stocks that are major factors in their industries and widely held by individuals and institutional investors.
NASDAQ
The NASDAQ Composite Index measures all NASDAQ domestic and non-U.S. based common stocks listed on The NASDAQ Stock Market. The market value, the last sale price multiplied by total shares outstanding, is calculated throughout the trading day, and is related to the total value of the Index.
MSCI Emerging Markets Index
The MSCI EM (Emerging Markets) Index is a free float-adjusted market capitalization weighted index that is designed to measure the equity market performance of the emerging market countries of the Americas, Europe, the Middle East, Africa and Asia. The MSCI EM Index consists of the following emerging market country indices: Brazil, Chile, Colombia, Mexico, Peru, Czech Republic, Egypt, Greece, Hungary, Poland, Qatar, Russia, South Africa, Turkey, United Arab Emirates, China, India, Indonesia, Korea, Malaysia, Philippines, Taiwan, and Thailand.
MSCI EAFE Index
The MSCI EAFE Index is a free float-adjusted market capitalization index that is designed to measure the equity market performance of developed markets, excluding the US & Canada. The MSCI EAFE Index consists of the following developed country indices: Australia, Austria, Belgium, Denmark, Finland, France, Germany, Hong Kong, Ireland, Israel, Italy, Japan, the Netherlands, New Zealand, Norway, Portugal, Singapore, Spain, Sweden, Switzerland and the UK.
Bloomberg US Aggregate Bond Index
The Bloomberg U.S. Aggregate Bond Index is an index of the U.S. investment-grade fixed-rate bond market, including both government and corporate bonds.
This newsletter is a publication of Kirk Capital Advisors, LLC. It should not be regarded as a complete analysis of the subjects discussed. All expressions of opinion reflect the judgment of the authors as of the date of publication and are subject to change. A professional advisor should be consulted before any investment decisions are made. Different types of investments involve varying degrees of risk, and there can be no assurance that any specific investment or strategy will be suitable or profitable for your investment portfolio. All investment strategies have the potential for profit or loss. Historical performance results for investment indexes and/or categories, generally do not reflect the deduction of transaction and/or custodial charges or the deduction of an investment management fee, the incurrence of which would have the effect of decreasing historical performance results. Kirk Capital Advisors, LLC is registered as an investment advisor and only transacts business in states where it is properly registered or excluded or exempted from registration requirements. Registration as an investment advisor does not constitute an endorsement of the firm by securities regulators nor does it indicate that the advisor has attained a particular level of skill or ability. ©2025 Kirk Capital Advisors, LLC.
Copyright (c) 2026 Clearnomics, Inc. All rights reserved. The information contained herein has been obtained from sources believed to be reliable, but is not necessarily complete and its accuracy cannot be guaranteed. No representation or warranty, express or implied, is made as to the fairness, accuracy, completeness, or correctness of the information and opinions contained herein. The views and the other information provided are subject to change without notice. All reports posted on or via www.clearnomics.com or any affiliated websites, applications, or services are issued without regard to the specific investment objectives, financial situation, or particular needs of any specific recipient and are not to be construed as a solicitation or an offer to buy or sell any securities or related financial instruments. Past performance is not necessarily a guide to future results. Company fundamentals and earnings may be mentioned occasionally, but should not be construed as a recommendation to buy, sell, or hold the company’s stock. Predictions, forecasts, and estimates for any and all markets should not be construed as recommendations to buy, sell, or hold any security–including mutual funds, futures contracts, and exchange traded funds, or any similar instruments. The text, images, and other materials contained or displayed in this report are proprietary to Clearnomics, Inc. and constitute valuable intellectual property. All unauthorized reproduction or other use of material from Clearnomics, Inc. shall be deemed willful infringement(s) of this copyright and other proprietary and intellectual property rights, including but not limited to, rights of privacy. Clearnomics, Inc. expressly reserves all rights in connection with its intellectual property, including without limitation the right to block the transfer of its products and services and/or to track usage thereof, through electronic tracking technology, and all other lawful means, now known or hereafter devised. Clearnomics, Inc. reserves the right, without further notice, to pursue to the fullest extent allowed by the law any and all criminal and civil remedies for the violation of its rights.